Recap
I have been trying to use Claude to create a Rust Symbolic Execution engine for angr based on inspiration from a blog post since late January. In August, I wrote about letting Ralph grind away for 10 weeks, chasing moonshots, and three waves of bug audits. This post covers many more audits, an exploration of the bugs that the audits found, and the latest benchmark results.
Just Keep Auditing
I was somewhat hopeful based on the trend from my first three bug audits that we were converging towards a codebase that was suitable to share with others. Those audits produced 217, 138, and 95 findings, respectively, categorized into bugs, tasks, and chores. Each of these audits was done from scratch and the trend was looking great. To my dismay, the next audit produced 83 issues. Not to worry, another Ralph session can fix those and then maybe the trend will resume? Nope. I proceeded to run the audit/ralph a total of eight times over a two-month period, producing a total of 855 findings (yikes). This table shows the number of findings (and their priorities) for each audit:
Audit findings per round with priority
| Round | Started | P1 | P2 | P3 | P4 | Total |
|---|---|---|---|---|---|---|
| 1 | 2026-07-31 | 8 | 48 | 89 | 72 | 217 |
| 2 | 2026-08-05 | 4 | 15 | 51 | 68 | 138 |
| 3 | 2026-08-08 | 5 | 8 | 27 | 55 | 95 |
| 4 | 2026-08-09 | 5 | 14 | 40 | 24 | 83 |
| 5 | 2026-08-12 | 7 | 7 | 24 | 41 | 79 |
| 6 | 2026-08-20 | 1 | 8 | 23 | 37 | 69 |
| 7 | 2026-09-04 | 6 | 12 | 36 | 32 | 86 |
| 8 | 2026-09-13 | 2 | 9 | 39 | 38 | 88 |
| Total | 38 | 121 | 329 | 367 | 855 |
These are based on Claude’s self-assigned priorities (assigned by a finder
agent and confirmed by a verifier agent). P1 is the highest priority and P4 is
the lowest. The number of P1s has generally decreased over time. I tried to
hold the audit workflow consistent across rounds (specifically, asking Claude
to do the N+1th comprehensive audit of the codebase) but the workflow ended up
drifting over time. The audits all started with the same goal: auditing
native/angr/src from multiple angles including correctness, DRY, and
organization. The way the codebase was split varied slightly for each audit.
Later rounds added a new angle for overflow and width-boundary bugs based on
bugs that were discovered in previous audits.
During the remediation phase, Ralph actually found about 20 more bugs that the audit rounds missed and filed them as additional findings (and a bunch of non-bug findings) under the same epics used to track the audit rounds. The bugs fell into categories like “fixed one site, then checked for the same shape elsewhere” and “writing tests for one bug surfaced another”. The reuse of the top-level epic confused Claude (and myself) when trying to document how many findings each audit identified (including an error in my previous post). It would have been better to snapshot the beads database after each audit to avoid this confusion.
Hidden in the table above is the breakdown of bugs, tasks, and chores:
Audit findings per round broken down by type
| Round | Bug | Task | Chore | Total |
|---|---|---|---|---|
| 1 | 60 | 21 | 136 | 217 |
| 2 | 37 | 0 | 101 | 138 |
| 3 | 21 | 12 | 62 | 95 |
| 4 | 41 | 0 | 42 | 83 |
| 5 | 20 | 59 | 0 | 79 |
| 6 | 0 | 69 | 0 | 69 |
| 7 | 21 | 14 | 51 | 86 |
| 8 | 22 | 66 | 0 | 88 |
| Total | 222 | 241 | 392 | 855 |
Again, these are based on Claude’s self-assigned categorizations for bug versus task versus chore. In round 6, it decided to make everything a task (specifically, the bead type, which we use for counting). It did put the intended category in the bead titles (e.g., “chore:”). Repo conventions (if they were actually enforced) could have improved our ability to compare audits.
Most of the audits were conducted with Opus. The last audit was done with Sonnet 5 and it still found plenty of bugs. I am curious to go in the opposite direction to see what an audit with Fable finds. Hopefully Fable 5.5 comes out soon and is token-efficient enough to make this feasible.
Bug Investigation
To better understand the bugs produced by these audits, I asked Claude to write me a script to tabulate, for each bug:
- When was it added?
- What model added it?
- What subcomponent was it in?
The script traces the lineage of each bug to identify when it was introduced
via git blame and some extra tracing. The extra tracing was due to a couple
of resets early on. Once the bug and its introducing
commit have been identified, the model that wrote the code can be extracted
from the Co-Authored-By line that Claude likes to append. The audits started
at commit 2e6cac6f5 (2026-07-30) and the analysis snapshot was at commit
8c157f891. The bugs introduced by model are as follows:
Bugs already in the code at the audit baseline (2026-07-30)
| Model | Bugs | P1 | P2 | P3 | P4 |
|---|---|---|---|---|---|
| Claude Opus 4.8 | 48 | 4 | 17 | 25 | 2 |
| Claude Opus 4.7 | 47 | 11 | 21 | 13 | 2 |
| Claude Opus 4.5 | 31 | 4 | 14 | 13 | 0 |
| Claude Opus 4.6 | 26 | 5 | 11 | 10 | 0 |
| Claude Fable 5 | 6 | 1 | 4 | 1 | 0 |
| Human / upstream | 6 | 0 | 4 | 2 | 0 |
| Ambiguous | 67 | 10 | 28 | 29 | 0 |
| Total | 231 | 35 | 99 | 93 | 4 |
It is surprising to see just how many models have contributed to the project. Opus 5.5 is too new to have written code before the beginning of the auditing. I usually switch to newer models as they become available (newer is always better) and was curious which models wrote most of the code. Perhaps models with many bugs just wrote more code:
Code at the audit baseline, with bugs per 1k production lines
| Model | Production | Test | Total | Bugs | Per 1k production lines |
|---|---|---|---|---|---|
| Claude Opus 4.8 | 38,889 | 24,704 | 63,593 | 48 | 1.23 |
| Claude Opus 4.7 | 29,910 | 19,962 | 49,872 | 47 | 1.57 |
| Claude Opus 4.6 | 18,222 | 4,096 | 22,318 | 26 | 1.43 |
| Claude Opus 4.5 | 12,784 | 1,706 | 14,490 | 31 | 2.42 |
| Claude Fable 5 | 2,230 | 1,510 | 3,740 | 6 | 2.69 |
| Human / upstream / bot | 3,213 | 328 | 3,541 | 6 | 1.87 |
| Claude Sonnet 5 | 467 | 770 | 1,237 | 0 | 0.00 |
| Ambiguous | — | — | — | 67 | — |
| Total | 105,715 | 53,076 | 158,791 | 231 | 2.19 |
Opus 4.8 wrote the most code (and bugs) but had the lowest bugs per 1k production lines. Sonnet 5 broke the measure by writing code with no bugs found (yet). There is a lot of noise in these measurements; hopefully some good papers on bugs/LoC across models come out soon.
Lastly, I wanted to understand what we actually did during all the fixing passes. This summarizes the changes in lines of code per subsystem:
What changed during the audit/fix loop, by subsystem (2026-07-30 → HEAD)
| Subsystem | Production | Tests |
|---|---|---|
| exploration | +3,008 (+17%) | +10,119 (+155%) |
| vex | +5,424 (+28%) | +3,503 (+159%) |
| symbolic | +2,230 (+18%) | +4,495 (+56%) |
| procedures | +1,383 (+15%) | +3,793 (+31%) |
| syscalls | +833 (+15%) | +2,779 (+33%) |
| memory | +1,281 (+27%) | +3,156 (+67%) |
| interpreter | +1,485 (+23%) | +2,892 (+132%) |
| state | +1,388 (+25%) | +3,190 (+112%) |
| arch | +956 (+29%) | +1,532 (+167%) |
| callbacks | −166 (−6%) | +1,379 (+334%) |
| All other | +1,513 (+15%) | +3,932 (+141%) |
| Total | +19,335 (+20%) | +40,770 (+80%) |
The tests grew significantly in comparison to the production code. This was due
to the prompt asking for a test case that failed on the bug and went green once
it was fixed. It would be interesting to see if one model wrote more of a given
subsystem than another (and whether that explains why some subsystems changed
more than others). I also need to revisit these numbers with cloc.
Finally, I had Claude review the bugs that it had found so far and gave it some rough guidance to create a rubric for the project. At some point, it would be interesting to do a retrospective for all audit findings against this rubric and see how things change.
Towards Merging
I doubt that the angr developers want to merge this any time soon. There are a lot of minor things that we have found along the way that I have started to carve out and submit PRs for:
libc: add getopt, getopt_long and getopt_long_onlymergedlibc: add str*_chk and __fprintf_chk, fix _chk prototypesmergedlibc: add stpncpy, memrchr, rawmemchr, strchrnul, asprintf and getlinemergedformat_parser, strtol: fix printf/scanf conversionsmergedglibc.json: fix __fprintf_chk and __sprintf_chk prototypes
There has also been a ton of movement in the upstream repo that I have had Claude update the rust-symex branch to match. Funnily enough, upgrading all the dependencies and checking the outputs uncovered another eight bugs in the Rust engine (five of which are P1s based on the new rubric).
Latest Benchmark
It has been a while since I benchmarked the Rust engine against the latest
upstream code. Inside my little VM with 8 CPUs and 8 GB memory, I had Claude
benchmark our Rust engine (commit 940333138) against the upstream engine
(commit d1e9ec806) using
angr-examples (commit c98733f):
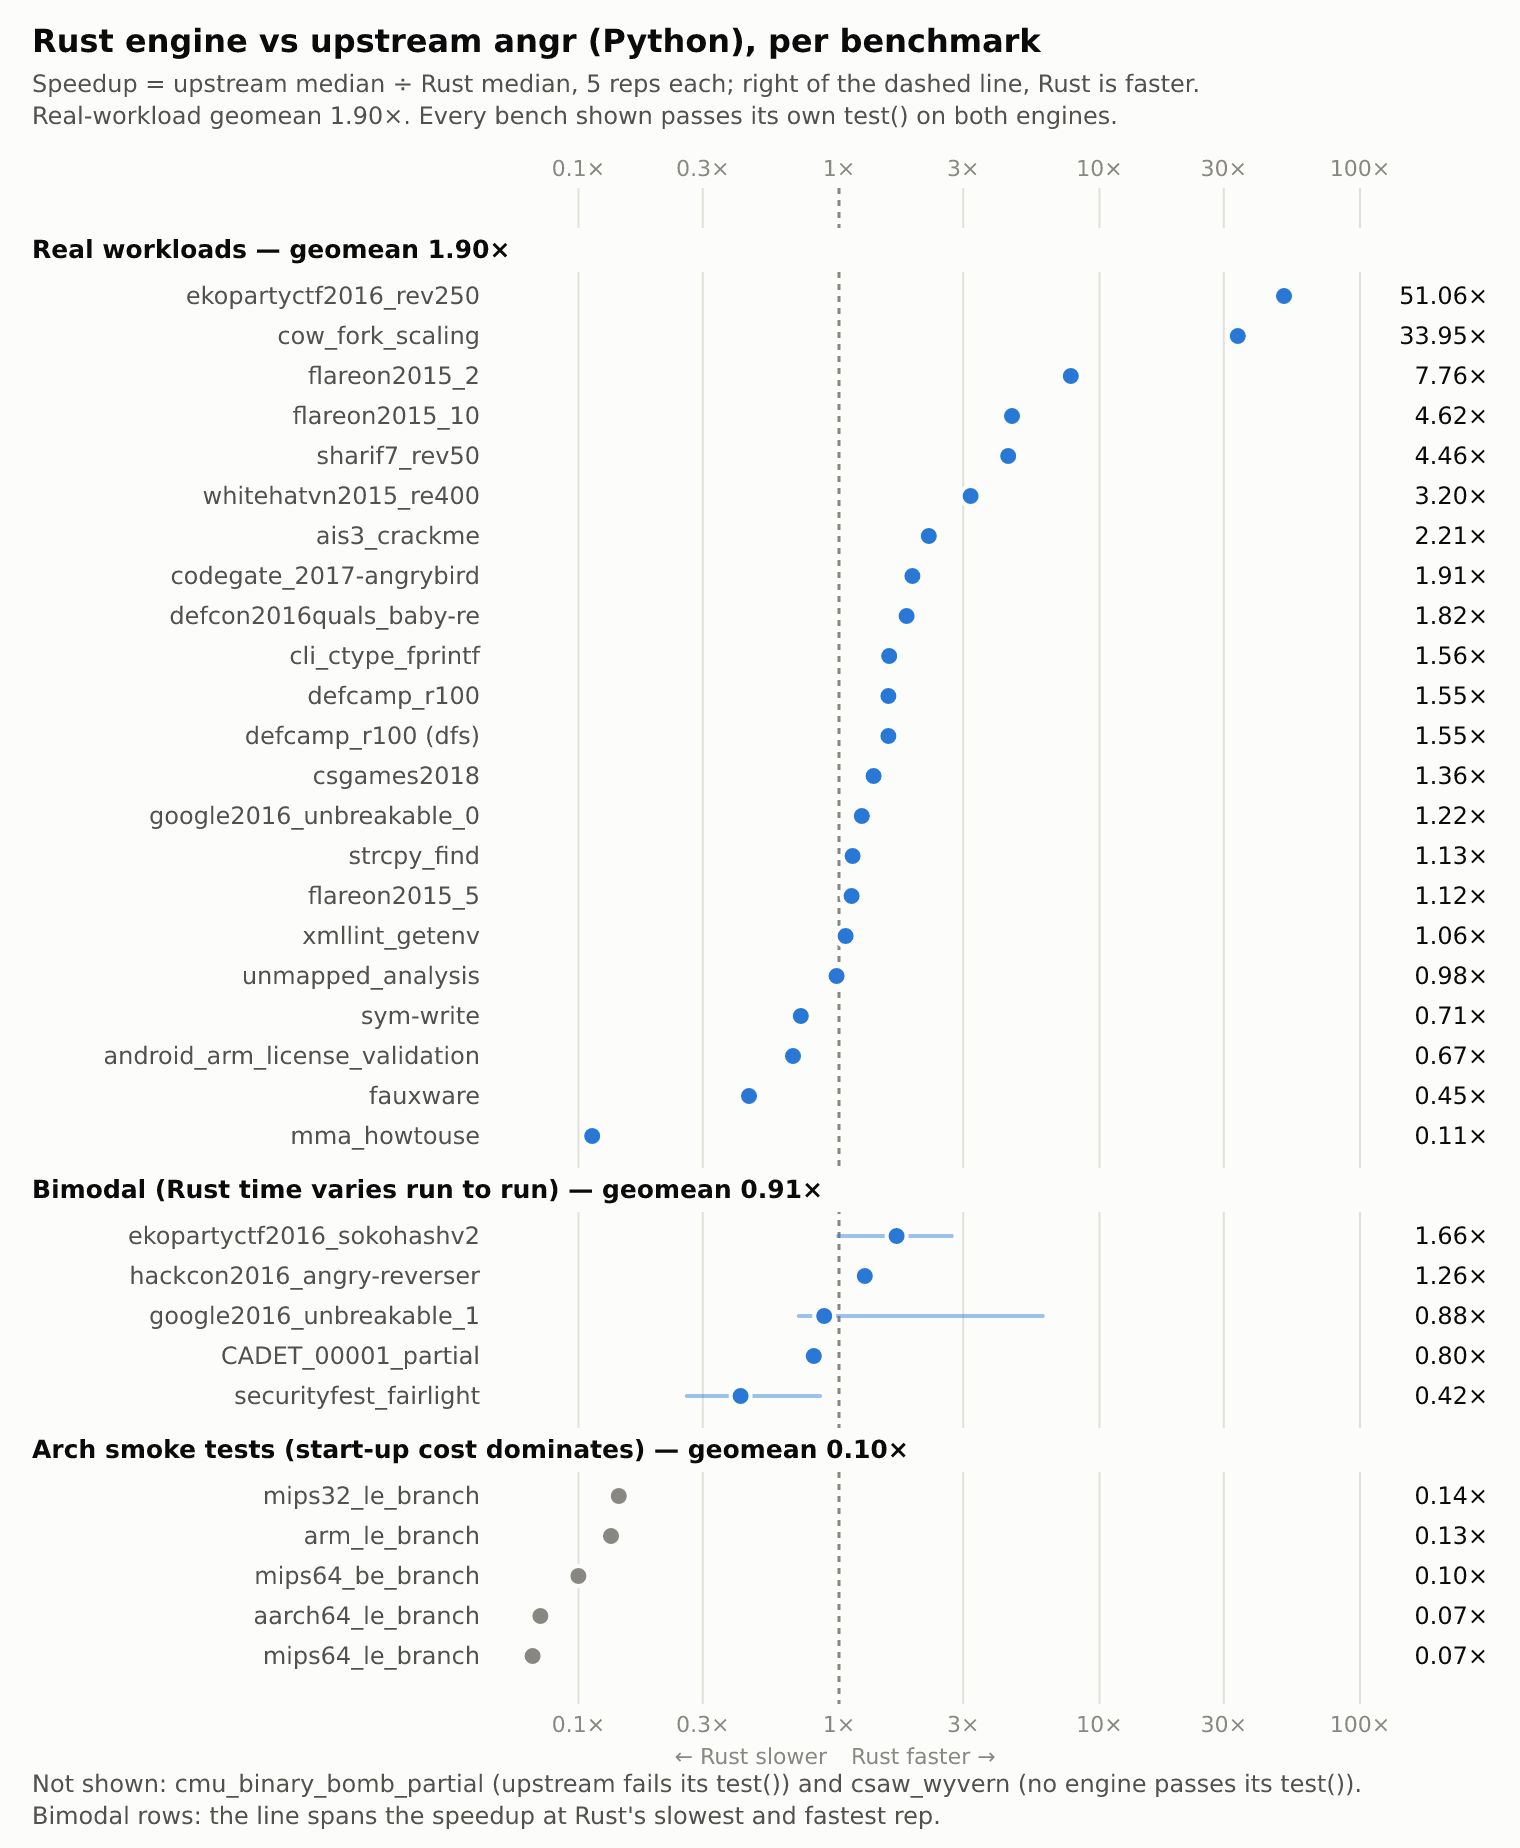
Speedup for Rust engine against upstream.
There is definitely a speedup, but the two biggest speedups come from subtle differences in the engines:
| Bench | As measured | Explanation | Equal footing |
|---|---|---|---|
ekopartyctf2016_rev250 |
51.06× | getenv modeling differs: Rust returns NULL, Python a symbolic pointer |
≈ 2.8× |
cow_fork_scaling |
33.95× | Rust skips the symbolic return-address enumeration | ≈ 4× |
flareon2015_2 |
7.76× | Upstream angr 10’s Rust-backed claripy is slow on min/max |
≈ 1.6× (vs the fork’s Python engine) |
flareon2015_10 |
4.62× | Genuine: identical work, faster interpreter | 4.62× |
sharif7_rev50 |
4.46× | Genuine: near-identical work, faster interpreter | 4.46× |
Lessons Learned
A few lessons learned from this process:
- Define a rubric (e.g., severity, categorization) for Claude to follow when filing bugs in your repo.
- Do not expect one audit to find all the bugs (or even a significant fraction of them).
- Expect fixing bugs to introduce new bugs.
Summary
At this point, I think the Rust symex engine is in decent shape. It would be neat to discuss with folks at SynSec but I cannot attend this time. Hopefully there will be another similar conference next year.